Too many candidates
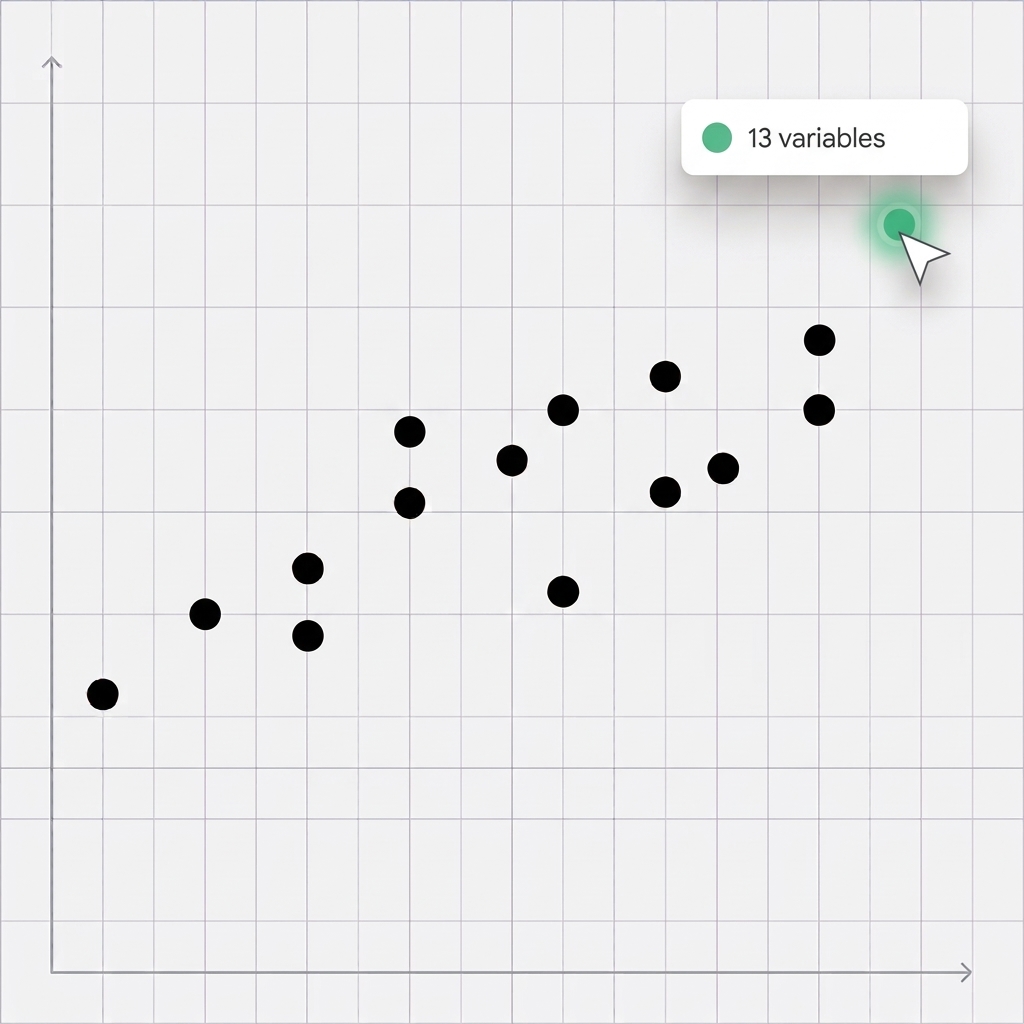
Testing variables one at a time makes it hard to see which combination adds durable signal.
Risk modelling
Exakt fits and compares multiple Explainable Boosting Machines (EBMs) at once, using smart variable selection. Automatic smoothing greatly reduces the manual work between fits.
Modelling challenges
Testing variables one at a time makes it hard to see which combination adds durable signal.
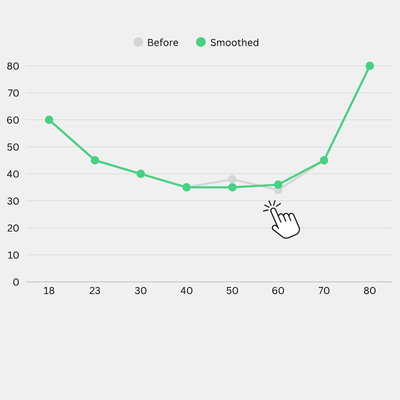
Repeatedly reshaping noisy functions takes time and can make decisions difficult to reproduce.

When alternatives overwrite each other, reviewers cannot see why one model was selected.
How Exakt helps
EBM's are additive in nature and can serve as a drop-in replacement for classic GLMs with near-GBM performance. Exakt's optimised implementation trains a single EBM up to 6x faster and achieves up to 10% higher predictive performance than the base implementation.
Explainable Boosting Machine (EBM) is additive, so you can inspect each factor's fitted effect on risk. Automatic smoothing reduces noise where data is thin and cuts the manual work between fits.
Original and auto-smoothed driver age relativities with exposure.
Compare candidate variable sets on holdout performance, calibration, stability and complexity. Use the gains from each addition to decide whether a larger model is justified.
Exakt automatically detects interactions worth testing. See which combinations matter and keep only those that improve the model.
The illustrative interaction spans complete driver-age bands from 17 to 93 and over. Exposure peaks in the middle age bands and falls in the tails. The interaction factor ranges from 0.82 to 1.18, with 1.00 as the neutral point.
Three-dimensional driver age and fuel type interaction view.
Drag to rotate · Scroll or pinch to zoom · Hover or tap a bar for values
Reduce noise in areas with less data while preserving the local patterns that matter.
Interactive geographic smoothing preview
Fit multiple candidates at once and compare them on the same holdout data. Branch from any candidate to test variables, interactions or geography.
| Candidate | Deviance ↓ | Calibration → 1 | Stability ↑ | Terms | Decision |
|---|---|---|---|---|---|
| Parent v18 | 0.421 Baseline | 1.04 | 0.88 | 32 | Keep |
| Branch A | 0.408 −3.1% | 1.02 | 0.85 | 47 | Review |
| Branch B | 0.411 −2.4% | 1.00 | 0.93 | 26 | Candidate |
Each addition creates a branch with its order, settings, diagnostics and decision recorded. Compare alternatives without overwriting the parent model.
Commercial decision
A clearer estimate of expected loss shows where the current price leaves room for a better offer and where the insurer needs more premium, different terms, or less exposure.
Check the expected close rate and margin across the portfolio.
Change the price, terms, or exposure before the claims result arrives.